TESSIN VISLab (Terrestrial Environmental System Simulation & Integration Network)
Short description:
TESSIN VISLab is a modelling and visualisation centre.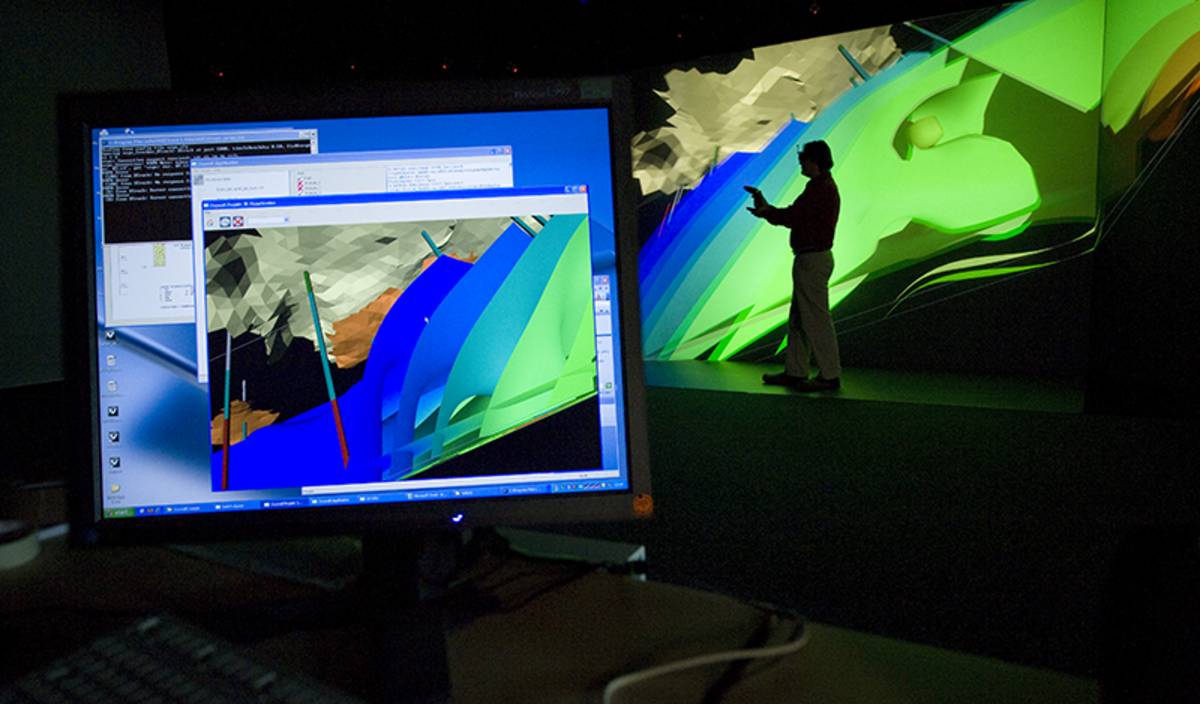


Major research issues/sites:
Scientific visualisation is an integral part of the modeling workflow, enabling researchers to understand complex or large datasets and simulation results. A high-resolution stereoscopic virtual reality (VR) environment further enhances the possibilities of visualisation. Major research areas include:
Hydrology: The challenge for visualisation in hydrologic research is the integration of a large variety of heterogeneous data from different sources at multiple spatial and temporal scales (Rink et al. 2012).
Climate: To predict changes in climate, meteorologists proceed in developing models that simulate the state of the atmosphere for a period of time. With an increasing of computational power, even the complexity of these models and their spatial resolution rises and produces large datasets with numerous variables (e.g. wind, mass fraction). Scientific visualization is an essential medium to explore, analyze and present these datasets (Helbig et al. 2014).
Geosciences and Energy: In geosciences we have to deal with 3D complex geological structures containing different architectural elements such as layers, faults, diapirs, fracture networks. Thermo-hydro-mechanical-chemical processes under extreme thermodynamic conditions have to be considered for utilizing geological reservoirs, e.g. for geothermal energy (Zehner et al. 2010).
Landscape and Biodiversity: Many man-made actions have an impact on landscapes as well as to biodiversity surrounding us and this should be communicated to and discussed with the public, so that people are aware of this fact. Virtual Environments are very well suited for the integration and visualisation of various data within a unique geographic context for discussion and decision making of different options (Zehner 2010).
Other research activities have been related to visualisation of urban environments and the development of generic visualisation methods.
Research references:
Zehner B, Watanabe N, Kolditz O (2010): Visualization of gridded scalar data with uncertainty in geosciences. Computers & Geosciences, 36: 1268-1275.
Zehner B (2010): Mixing Virtual Reality and 2D Visualization - Using Virtual Environments as Visual 3D Information Systems for Discussion of Data from Geo- and Environmental Sciences, GRAPP 2010.
Rink K, Kalbacher T, Kolditz O (2012): Visual data management for hydrological analysis. Environ. Earth Sci., 65(5): 1395-1403.
Helbig, C., Bauer, H.S., Rink, K., Wulfmeyer, V., Frank, M., Kolditz, O.: Concept and workflow for 3d visualization of atmospheric data in a virtual reality environment for analytical approaches. Env Earth Sci (2014). DOI 10.1007/s12665-014-3136-6
Short technical description:
As shown in the above figure (picture 2), depicting the overall hardware setup of the TESSIN VISLab, we use a back projection-based stereoscopic visualization environment, purpose-built by BARCO, with an approximately 6x3 meter large main screen and corresponding projections on the floor and two side wings. In order to achieve a high resolution of approximately 6400x1800 pixels, 13 SXGA+ projectors (BARCO Galaxy) are used to run this system. The image is generated frame sequentially for the left and the right eye and users wear special glasses which separate these images, so that they get a real 3D stereoscopic view. For the stereo separation we can switch between two technologies – active stereo, using shutter glasses and passive stereo, using Infitec and BARCO’s Active Infitec+ technology. We use an ART tracking system, so that viewers can turn their head and move while the image is always computed in a way that correctly maintains perspective, and they can move through the virtual landscape using a pointer. The rendering is done using a computer cluster with 13 workstations that has been purpose-built by SysGen. Each workstation is fitted with high-end NVidia QuadroFX 5500 graphics boards which are synchronised using GenLock and SwapLock. In addition to the normal network, the workstations are interconnected using Infiniband.
Specific features/uniqueness:
The TESSIN VISLab is a unique research facility combining a remarkable technical environment with profound knowledge in visualisation methods and data analysis techniques. Such an environment also allows to collaborate in work groups including people of different backgrounds and to present results of a research project to stakeholders or the public.
Options and conditions for visiting scientists:
The TESSIN VISLab is an open laboratory for research and education:
- freely available subject to time constraints and scientific priorities,
- open for joint projects
Unit Cost of use and principles of costing:
Current research activities are driven by joint projects or common research interests.
centre running the infrastructure:
UFZ - Helmholtz Centre for Environmental Research
type of facility:
Simulation & Visualisation lab
Contact
- UFZ - Helmholtz Centre for Environmental Research
- Phone: +49 341 235-0
(Lars Bilke (MSc), Prof. Dr. Olaf Kolditz)